Showing posts with label Maps. Show all posts

Wednesday, February 23, 2022

Four Great Surveys of the American West

After the Louisiana Purchase, the U.S. Government was interested in trying to get a basic understanding of what was in the vast new lands the country had acquired. Towards that end, the government sent out a number of surveys in the early nineteenth century. These included the Lewis & Clark expedition of 1803-1806, Zebulon Pike’s of 1806-07, and that of Stephen H. Long in 1819-20.


The Long expedition ended the official exploration of the West for about two decades, until finally in 1838, the U.S. Army established the Corps of Topographical Engineers, the purview of which included exploring and mapping the West. Among the most important of their surveys were the five expeditions led by John C. Frémont between 1842 and 1853.


After mid-century, exploration of the West picked up significantly when in 1853 Congress authorized $150,000 for the exploration of possible railroad routes across the continent, creating the Pacific Railroad Surveys to investigate possible routes across the West at four different latitudes. The results of these surveys were depicted in G.K. Warren’s important “Map of the Territory of the United States from Mississippi to the Pacific Ocean,” which summed up the government’s understanding of the West on the eve of the Civil War.


After the Civil War, the nation turned its attention even more to the American West, which was seen as an area of huge potential economic development. This led to a demand for better information on the region, a demand that was partially met by the General Land Office. The GLO was responsible for the surveying, platting and sale of public lands, so while their surveys were very important for the economic development of the West, there were large sections of the region they did not cover.


The Federal government was particularly interested in the economic resources of the West, which had not been a focus of the earlier military surveys. Thus, the government modified its surveys so that were more scientific, rather than military. These were called “geological” surveys, “geology” at the time having a wider definition than now, referring broadly to the science of the earth, including within its compass botany, soil science, archaeology and anthropology.


The first government survey dedicated to studying the geological, and thus economic aspects of a far western state was the 1860-74 California Geological Survey led by Josiah D. Whitney. This survey is important for several reasons, not the least of which was the new procedure for surveying alpine landscapes developed by its lead topographer, Charles Frederick Hoffmann.


The California Geological Survey established the methods and aims for future surveys by the U.S. Government, which in 1867 authorized the first in a series of systematic scientific surveys of the West. These became known as the “Four Great Surveys,” which ran pretty much concurrently and lasted until 1879.


King Survey (1867-73)
The first of these surveys, authorized on March 2, 1867, was the U.S. Geological Exploration of the 40th Parallel, led by Clarence King, who had worked on with the California Geological survey. The purview of the King party was to survey the lands on either side of the Pacific Railroad from California to eastern Wyoming and it was designed primarily as a practical survey to determine the economic potential of the lands along the railroad route.


The King survey resulted in the publication of a Geological and Topographical Atlas in 1876. This included a general map, then five each of topographical and geological sectional maps in sequence along the route of King’s survey. The maps were done in very large size—most sheets measure 29” x 42”—these are rare and fascinating images of the western part of the lands on either side of the 40th parallel.


Hayden Survey (1867-79)
The second of the Great Surveys began the same year as the King survey. This was led by Ferdinand V. Hayden and though it started off focused on Nebraska, within two years it became the U.S. Geological and Geographical Survey of the Territories. Hayden’s survey eventually encompassed parts of Nebraska, Wyoming, Idaho, Montana, and particularly Colorado.


Hayden issued yearly reports and these standardly include illustrations as well as maps of the different areas he surveyed. The most impressive of his cartographic publications was the 1877 Geological and Geographical Atlas of Colorado, which included four general maps of the entire state, as well as topographical and geological maps of the state broken into six sections. These provide the first comprehensive and accurate mapping of the Colorado, just a year after statehood.


Powell Survey (1870-78)
The third of the four Great Surveys was the U.S. Geographical and Geological Survey of the Rocky Mountain Region led by John Wesley Powell, a survey which lasted from 1870 to 1878. Powell had become convinced that the Colorado River canyons could be explored only by boat, so in 1869, Powell formed a private expedition and set off down the Green and Colorado Rivers. The expedition members are the first known Euro-Americans to traverse the Grand Canyon.


As the 1869 expedition ended up being more about survival than science, and as much of the data he had gathered was lost, Powell asked Congress to authorize another exploration of the Grand Canyon. This Congress did with the creation of the third of the Great Surveys, the scope of which was not only the Grand Canyon, but also the surrounding plateau lands. Powell was involved in the production of a number of maps, some of which appeared in reports from this survey, but there was no major cartographic publication which resulted.


Wheeler Survey (1872-79)
The last of the four Great Surveys was under the command of Lieutenant George Montague Wheeler. Wheeler had led surveys in eastern Nevada and Arizona in 1869. These were under the aegis of the U.S. Army’s Corps of Engineers and the surveys had primarily military objectives. By 1870, with the creation of the other three, essentially civilian surveys, the military became concerned that the job of mapping the American West was being taken away from them. Wheeler came up with the idea of having the Army survey the entire country west of the 100th meridian. The Army bought into this concept and convinced Congress that this was a good idea, so in 1872, money was appropriated to form the U.S. Geographical Survey West of the 100th Meridian.


Wheeler was never able to complete his work, though he did map a large portion of the West by the end of 1879, covering about 360,000 square miles, though that was only about on quarter of the area originally intended. Beginning in 1876, Wheeler issued a number of maps, along with a title page for a “Topographical Atlas.” The idea was that Wheeler would issue maps as the survey progressed, with the sheets eventually all gathered into this atlas. This did not happen; the intended atlas was never completed. Over the years, however, Wheeler did continue to produce maps, most sheets showing one quarter of one of his 95 quadrangles. Each year Wheeler also produced a progress map illustrating the areas that had been surveyed. Wheeler stopped surveying in 1879 but continued to issue reports and maps until 1884.


In the end Wheeler produced 71 topographical maps. Initially he was criticized for not showing enough information about the natural resources of the areas mapped, so Wheeler started to add economic or land-use maps, as well as some geological maps. Craig Haggit, of the Denver Public Library, has produced a very nice web page about the Wheeler maps, which can be seen by clicking on this link.


Competition between the surveys
It is not really surprising that right from the beginning there was competition between the Four Great Surveys, as they ran pretty much concurrently and covered overlapping areas of the West. There was a conflict between the military and civilian surveys, the military wanting to have authority over the western surveys and the scientific community wanting the same thing. There was also conflict over getting money from Congress, as there were limited funds and each survey wanted to make sure they received sufficient appropriations. Finally, there was conflict over the scope of each survey. For instance, at one point Powell tried to extend his survey to encompass the entire Rocky Mountains, but Congress demurred, saying the Rockies belong to the Hayden survey.


The most consequential of the conflicts was between Hayden and Wheeler, whose territories did overlap. This came to a head on July 9, 1873. Wheeler had sent a party, under Lieutenant W.L. Marshall, to survey south-central Colorado and at the same time Hayden had sent one of his survey parties into the South Park area, which was just where Marshall was working.


Hayden describes what happened:

“As we were riding down into the south Park, about the 9th day of July, we came across Lt. Marshall’s party and we camped together. He was a very courteous gentleman and we were very friendly. We talked matters over, and some regrets were expressed that we were on the same ground. I simply stated to him...that I had no option but to perform this work and we had had the Territory of Colorado assigned to us as a field of exploration. He simply said that he was under orders, and therefore could not disobey his orders.”
As a result, both parties set about surveying the same area in a ridiculous duplication of effort.


It was inevitable that this conflict would come to the attention of Congress. This happened when the War Department demanded an investigation in hopes of asserting its authority, through the Wheeler survey, over all the surveys of the West. As a result, the following year, the Townsend Committee on Public Lands of the House of Representatives met to consider the conflict.


One tack taken by the military was to attack Hayden personally. Marshall accused Hayden of rushing into the area specifically to preempt Wheeler (which may or may not be true). Also, supposedly, as reported by Wheeler’s geologist, Hayden was quoted as having said, “You can tell Wheeler that if he stirs a finger or attempts to interfere with me or my survey in any way I will utterly crush him—as I have enough congressional influence to do so and will bring it to bear.”


Despite these attacks, Wheeler and the military were for the most part on the defensive, as the entire scientific community backed Hayden. Wheeler’s process and maps were assailed, with Hayden’s worked stated as being much better. However, Wheeler had the backing of President Grant and in the end the Congressional committee did nothing, concluding that “there is an abundance of work for the best talents of both the War and Interior Departments in the scientific questions of the Western Territories for many years to come.” Still the committee did reprimand Hayden and Wheeler for “ill-judged and hasty expressions...which good taste would have withheld.”


The problems of having so many concurrent government surveys in much the same area persisted. The concern over this was aggravated by the rising costs of the surveys, so in the spring of 1878, the House Committee on Appropriations undertook to see if the surveys could be consolidated and condensed. At this stage, the King survey was already done, but Hayden, Powell and Wheeler were all still in the field.


In the end Congress decided that the General Land Office was to continue to survey public lands, the Coast and Geodetic Survey would continue to do “first-order triangulation of the whole country,” but a new “U.S. Geological Survey” was to “assume all surveying, mapping and geological investigations in the West.” As a result, on March 3, 1879, the U.S. Geological Survey was established, replacing the remaining three Great Surveys and beginning a new chapter in the surveying of the American West.


Wednesday, May 27, 2020

Whirlpool at the North Pole

In 1569, the great Flemish cartographer, Gerard Mercator, issued this important world map—-the first to use the so-called Mercator projection—-and on that map he introduced a radical and strange notion of the geography around the North Pole. Along the very top of the map-—the width of which is exaggerated because of the projection used-—are four bodies of land with rivers running between them.


This geography was clarified by an inset in the lower left, in which you can see four islands surrounding the North Pole, upon which lies a large rock.


It is a little easier to see this geography on Mercator's separate map of the North Pole issued a number of years later. A legend on the earlier map states that Mercator got his geography of the Arctic from the report of a Friar and mathematician from Oxford, who supposedly in about 1360, and using “magic arts,” went to these polar islands and mapped them. Mercator’s source of this story was a since lost, fourteenth-century account called the Inventio Fortunatae.


Describing the geography of the polar region, Mercator wrote to John Dee, an English scholar and mystic, that “In the midst of the four countries [that is islands] is a Whirl-pool...into which there empty the four Indrawing Seas which divide the North. And the water rushes round and descends into the earth just as if one were pouring it through a filter funnel...Except that right under the Pole there lies a bare rock in the midst of the Sea. Its circumference is almost 33 French miles, and it is all of magnetic stone...”


Mercator shows this geography very clearly, with the four islands separated by the rivers and the large magnetic rock sitting on the pole itself, over the whirlpool where the waters descend into the interior of the globe. Other bits of information depicted by Mercator, also taken from the Inventio, include the legend that “pygmies, whose length is four feet” live on the island above Scandinavia, and another legend on the island to its left, stating it is “the best and most salubrious in all the north.”


Obviously, this is mythical geography, though the Inventio Fortunatae may have been based to some extent on first-hand reports by Ivar Bardarson, who was a priest from Greenland who traveled widely in the eastern Canadian Arctic in the early fourteenth century. Whether the story of the waters of the world passing through four rivers and then into the whirlpool was a confused misreading of Bardarson’s reports, or an illusionary creation of the Inventio’s author cannot be known.


The Mercator conception was followed by a number of other late sixteenth century cartographers, such as in the world map by Abraham Ortelius from 1570.


However, this misconception did not hang around for long. The latter half of the sixteenth century was a time of considerable exploration in the waters north of Europe, for instance by Hugh Willoughby in 1553 and Willem Barentz in the 1590s, and Mercator’s polar geography of the four islands and the whirlpool began to lose favor, as shown in Barentz’s own map of the polar region from 1598. This geographical myth subsequently did not last long, and it had disappeared from most maps by the fourth decade of the seventeenth century.


[Click here to see on-line lecture on this myth
and the myth of the great continent at the South Pole.
]


Wednesday, December 19, 2018

The format is the message

One thing that map dealers and map collectors learn early on is that the format in which a map was published has a great deal to do with its historic significance and its monetary value. A very rare example of a hugely important map of the American West is a nice example of this truism.


In 1843, in response to the great American migration to Oregon and the American West, the U.S. Corps of Topographical Engineers sent out John C. Frémont to survey and map what would soon come to be known as the Oregon Trail up to the South Pass. Two years later, Frémont was sent out again, at the instigation of Senator Thomas Hart Benton (Frémont’s father-in-law) to further explore the western part of the country, following the Oregon Trail all the way to the Pacific Ocean. On his return, Frémont passed to the south of the Great Basin, establishing for the first time the basic outline of the vast region which would become, in just a few years, the western part of the United States.


In 1845, Frémont was sent out again, in part because of the tensions between the U.S. and Mexico which would lead to armed conflict the following year. Frémont arrived in California just when local ferment led to an American rebellion which soon became part of the wider Mexican War. Frémont was appointed the first Governor of California, but soon became embroiled in a conflict with the military commander of California, General Stephen W. Kearny. This led to Frémont being sent back east under arrest and to his eventual court-martial and dismissal from the army.


Despite the personal failure of this 1845-46 expedition, the 1848 publication of a journal of Frémont’s explorations, entitled Geographical Memoir upon Upper California, was well received, and the map it included, “Map of Oregon and Upper California,” which Charles Preuss produced based on Frémont’s surveys, is a cartographic landmark, one of the most important maps of the American West. It depicts the entire west from the Colorado foothills to the California coast, and from the new Mexican border to the northern border of Oregon. Drawing on an earlier Frémont/Preuss map of the region from 1845, as well as other authorities, this map is corrected and filled in considerably, making it by far the best map of the region to date.


As Frémont himself wrote in his Geographical Memoir, “The map has been constructed expressly to exhibit the two countries of Oregon and the Alta California together. [These territories officially became part of the United States between 1846 and 1848.] It is believed to be the most correct that has appear of either of them...” The importance of this map is indicated by the fact that Carl Wheat gave more space to the description of this map than to any other in his seminal Mapping the Trans-Mississippi West.


The Frémont/Preuss map was probably issued in September, 1848, just after information about the discovery of gold in California reached the east coast. This was reflected in two very small legends on the map, “El Dorado or Gold Region,” placed along the South Fork of the American River and on the upper part of the Rio d.l. Plumas (Feather River), both flowing out of the foothills of the Sierra Mountains. Though inconspicuous, these legends makes the Frémont/Preuss map the first general circulation map to include any mention of the California gold discovery of 1848.


As the news spread of this discovery, through President Polk’s announcement on December 5th and then all the subsequent newspaper articles and private publications, there was an immediate demand for information on the gold strike, especially for maps which prospective prospectors could take with them. Many publishers rushed maps to the market, many containing spotty or completely erroneous details, but the maps which had any accuracy were mostly based on the Frémonth/Preuss map, which was without questions the best map of California available at that time.


The same demand led to an 1849 reissue of Frémont’s Geographical Memoir, with its maps, as well as a reduced version of the “Map of Oregon and Upper California,” which focused on California, eliminating Oregon Territory and the Rockies.


What has not previously been reported is that there was the reissue of the full-size “Map of Oregon and Upper California” specifically designed for those planning to head to the “Gold Regions” of California. Rather than being a map that was issued in a report, this was produced as a separately issued pocket map.


The convenience of having maps that folded into a small size had been obvious ever since maps became items that were sold to the general public. For those wanting to take a map with them when they traveled, these maps could be easily carried in a pocket or bag. In the nineteenth century, these maps were printed onto banknote paper, which is tough yet thin, so it could be folded without as much wear. The maps were folded into covers and were usually brightly colored to make them easier to read when on the road. For those heading to the California gold fields, the need for such a map would be clear.


Thus, a pocket map edition of the Frémont/Preuss map was issued, probably either right at the end of 1848, or in early 1849 (the date on the map states 1848, but that is from the original title, which the map contains). The covers of the map are entitled "Fremont's Map California. &c." It was printed from the same stone as the original edition, but with a number of changes made, besides the obvious format change.


First, typically of pocket maps, this map was much more brightly and extensively colored than the original issue. Secondly, two additions were made to make the map more useful to the California gold seeker. A large legend, “Gold Regions” is placed along the foothills of the Sierra Mountains, colored with gold highlighting.


Then inserted into the upper right corner is a map “showing the various routes from New York to San Francisco.”


It isn’t clear who published the map, but given the use of the original stone Frémont may very well have been involved in its production—perhaps hoping to cash in on his explorations after their rather unpleasant ending. An extensive search has turned up only two copies of this version of the map, and while all pocket maps from the 19th century have a high attrition rate, this would seem to indicate that this map did not sell as well as the publisher would have hoped. This scarcity, and its historical significance, make it perhaps as desirable a map of related to the California Gold Rush as any. A true nugget from the California Gold Rush.


Friday, May 11, 2018

A Cartographic War

On May 15, 1756, Britain declared war on France, opening the Seven Years War, the American part of which was called the French & Indian War. Though that was the official start of the French & Indian War, fighting had actually been going on for almost two years before that between the French and British in America. Beginning even earlier, however, was a cartographic war which was very much a prelude to the “hot” war that followed.

By the late seventeenth century, the French colonies in America consisted of two main parts. New France, or Canada, bordering the St. Lawrence River and the Great Lakes, and La Louisiane, considered by France to include the entire Mississippi River basin. The British lands in America at that time consisted of a series of colonies along the Atlantic coast, with a number of the original charters stating that they ran “from sea to sea,” though in practical terms they were limited to lands east of the Appalachian Mountains.

It wasn’t long before the British colonies began to look to expand. Their population was growing rapidly; for instance, it grew from about 250,000 in 1700 to over 1 million by 1750. The French were naturally concerned about British expansion. They had a relatively small population (only about 50,000 Europeans in 1750), and they saw British expansion as creating competition to their fur trapping and Indian trade.

This led to a series of Wars: King Williams War (1689-97), Queen Anne’s War (1702-1713), and King George’s War (1744-1748). Despite all this fighting, the treaties which ended those wars did not resolve the problems between the French & British in North America.

The Treaty of Utrecht ended Queen Anne’s War in 1713. By its terms, the French ceded to the British the lands around Hudson’s Bay, the island of Newfoundland, and Acadia, which the British called Nova Scotia. The problem with the treaty, though, was that the exact definitions of the regions mentioned were ambiguous, with a boundary commission supposed to adjudicate the exact borders. The commission didn’t meet until 1720, and then never really got anywhere.

The Treaty of Aix-la-Chapelle ended King George’s War in 1748. By that treaty, North America was supposed to return to the situation ante bellum. However, what that situation was, was no clearer then than it had been at the end of the previous war.


Naturally, French and British mapmakers tended to reflect their nation’s outlook on the issues related to North America, and this led to what has been called a “cartographic war.” This notion is well known among map dealers and collectors, the idea being that the maps for each side made claims promoting their colonies while diminishing the other country’s colonies. The idea is that each side was ‘flying the flag’; reflecting national pride. However, the cartographic war was much more than this and the story is worth examining closely.
Maps were one of the few ways European powers could establish their claims to territory. In the wilderness of North America, with relatively few settlements at the edges of the territories, the location of a border was often not marked in any way in the physical world. A line drawn on the map might be the only physical manifestation of a border. Sometimes, maps created the territories more so than any action on the ground.

Borders depicted on maps could have a reality beyond simply a line drawn on paper. Printed maps have an aura of legitimacy. If a feature is “on the map” the tendency is usually to accept it as real. If a particular border line was not questioned, then this could be taken as de facto evidence of its acceptance. Also, treaties often referred back to previous political situations, and what was shown on maps was sometimes the only way that this could be determined.

Besides their reifying power concerning borders, maps also had a considerable influence on public opinion. For instance, they could stir up the public if citizens thought another country was taking away their land, stiffening their resolve to resist any diminishing of the territory as shown on a map. The public’s attitude could in turn influence the government, so maps did sometimes have an effect on government decisions.

For all these reasons, the cartographic war which raged in the first part of the eighteenth century is best seen as a non-military, but still significant part of the conflict between France and Great Britain.


The first map in the cartographic war was this one by British cartographer Herman Moll. It was issued just two years after the Treaty of Utrecht as a statement of the British view of her colonies as determined by that treaty.

In the north it shows the British colonies as extending all the way north to the St. Lawrence River and up to the Great Lakes as far as Lake Erie. The colony of Carolina, which has its own inset, is shown extending south to just a bit above St. Augustine.

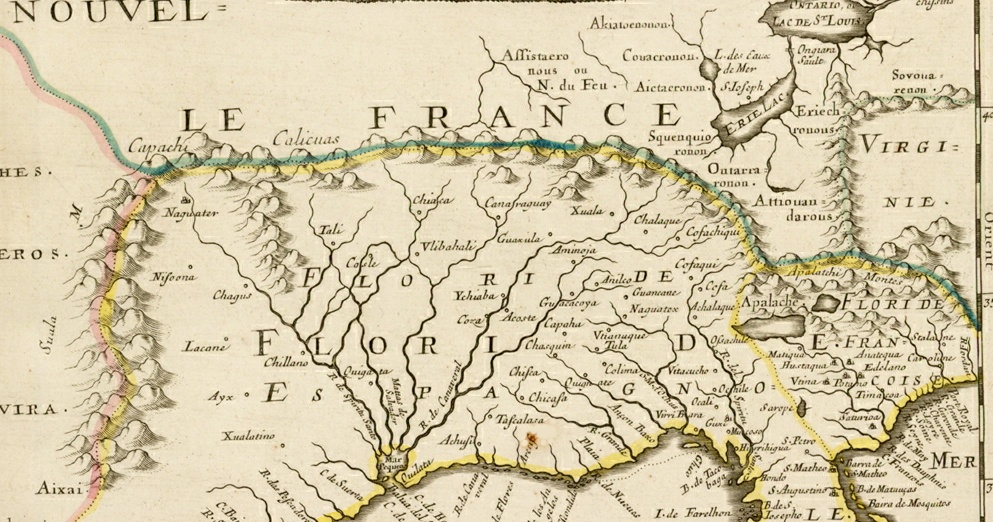
This British volley was answered just three years later by French cartographer, Guillaume Delisle.

Delisle moved the British border well south and east of the Great Lakes and the St. Lawrence River. He also claimed that Carolina was named after Charles IX of France and settled originally by the French, in effect claiming that region for France as well.
This map provoked considerable consternation in Great Britain. Because Delisle was the Premier Géographe du Roi, that is geographer to the King, his maps were regarded as semi-official, reflecting the views of the French government.


The publication of Delisle’s map provoked Herman Moll to issue a new map of North America to highlight the “Incroachments” shown on Delisle’s map, as a warning to the British of what the French were doing. A note on the map explained that
“All within the Blew Colour of this map, shews what is Claim’d by France...According to a French Map published at Paris with the French King’s Privelege. The Yellow Colour what they allow ye English.” Moll concluded that “any body may see how much they [that is the French] would Incroach &c.”


The New York officials were particularly upset about the French cartographic claims, as much of the land they considered to fall within their jurisdiction was usurped in Delisle’s map. Governor William Burnet wrote to the Board of Trade that “I observe in the last Mapp published at Paris with Privilege du Roy par M. de Lisle in 1718...that they are making encroachments on the King[‘s] territories...”
Many of the British claims around the Great Lakes were based on their long standing relationship with the Iroquois, especially concerning the treaties which they believed gave them the rights to the Iroquois lands. This British position was reinforced by a clause in the Treaty of Utrecht which stated that the Iroquois were British subjects. In 1724, Cadwallader Colden, the Lieutenant Governor of the colony, issued the map above to show how the region around the Great Lakes belonged to New York through their treaties with the Five Nations.

The British government felt the need for better maps, so it ordered the Lords Commissioners of Trade and Plantations, more commonly called the Board of Trade, to send a circular letter on this point to the Governors of the various colonies. The Board was the primary policy-making and administrative agency for the British colonies and in 1719 it sent the following instructions:
“It being necessary for H.M. Service and for the benefit of the Plantations, that the limits or boundaries of the British Colonies on the Continent of America, should be distinctly known and marked out, more particularly so far as they may border on the settlements made by the French or any Foreign Nations, we desire you to send us, as soon as possibly can, the best informations [sic] you can get upon your Government, together with a chart or map, and the best accounts and vouchers you can obtain to support the same....”


David Rumsey Map Collection

This resulted in a number of new maps being sent to the Board from the colonies. As the maps arrived in London, an assistant clerk to the Board, Henry Popple, compiled a general map of the “British Empire in America” with the Board’s “approbation.” As he stated on the map
“great care has been taken by comparing all the maps, charts, and observations that could be found, especially the authentick records and actual surveys transmitted to their Lordships by ye governors of the British Plantations and others to correct ye many errors committed in former maps.”

Issued in 1733, Popple’s production was a huge and detailed map which represented the best British mapping of the continent to date. The Board of Trade initially seemed impressed, writing to the Lords of Treasury that
“Mr. Henry Popple having with great care and Diligence drawn a Map of the British Empire in America, which, from the assistance he has had, from the best Charts and actual Surveys, is rendered infinitely more complete than any other now extant.”

Not only was the map detailed and based on the “best Charts and actual Surveys,” but it exhibited an expanded view of British holdings in America compared to Delisle and Moll. Nova Scotia is depicted as extending north all the way to the St. Lawrence River, and New York and Pennsylvania are shown reaching to the Great Lakes, while North and South Carolina are clearly depicted as British colonies.

However, British critics soon appeared. Popple was criticized for relying too much on French maps for his sources and for not taking a strong enough position relative to the extent of the British colonies. For instance, though New York and Pennsylvania reach the Great Lakes, Fort Niagara, on the eastern side of the Niagara River, is shown as part of French Canada. In 1738, Cadwallader Colden, clearly referring to the Popple map, wrote that “The English maps are such servile copies of the French that they mark out the boundaries between the English and French with the same disadvantage to the English as the French do.”


In the 1720s and 30s, the main area of conflict between the French and British in North America concerned the region north of New England and south of the St. Lawrence River. By the Treaty of Utrecht, in 1713, the French had ceded “all of Nova Scotia or Acadia, in its entirety, conformable to its ancient borders.” The British understood “Nova Scotia” as encompassing the entire region up to the St. Lawrence, today’s New Brunswick and Nova Scotia, whereas the French understood it as applying only to the Nova Scotia peninsula.
In 1740, political tensions in Europe led to the War of Austrian Succession, between Austria and France allied with Prussia. Great Britain was drawn into the war as an ally of Austria, declaring war on France in 1744. The war between France and Britain almost immediately led to armed conflict in the northern parts of America, what is called King George’s War. Various raids and battles occurred, with the only major event being the British capture of the fortified French port of Louisbourg. This war ended with the Treaty of Aix-la-Chapelle in 1747, which essentially restored the situation in North America ante bellum, a situation which, as I have said, was ambiguous and contentious.

Like with the Treaty of Utrecht, the new agreement called for an Anglo-French commission to meet and determine the borders of the regions referred to in the treaty. Beginning in 1750, commissioners met in Paris to negotiate on these matters. By that time, two main areas of conflict had developed. One was the old issue of what meant by “all of Nova Scotia or Acadia according to its ancient borders.” The other concerned the Ohio River Valley.

The French well knew that the British colonies were wealthier and more populous than their own, and they were afraid that the British would expand westward into the regions they depended on for their fur trapping and Indian trading. In 1749, Pierre-Joseph Céloron de Blainville led a French expedition down the Ohio River, leaving engraved plates along the way expressing French claims for the Ohio River.

Meanwhile, the British were starting to focus on their own claims to the lands west of the Appalachian Mountains, based on the original charters. A number of groups were formed to pursue British settlement and development across of the mountains, and these were granted large tracts of land by British colonial governments. Obviously, French and British interests conflicted in the Ohio River Valley.


Library of Congress

This map by British map publisher Robert Sayer shows, from the British perspective, “The Limits of His Majestys several Provinces...here laid as they at present exercise their Jurisdictions.”

The British colonies are shown encompassing all the lands south of the St. Lawrence, and extending all the way to the Mississippi. To make sure the point was clear, Sayer added a note that said:
“The French have streched [sic] their Louisiana on both sides the Mississipi [sic], which is another instance of their Incroachment, for they have no just claim to any part of the Country lying Eastward of that River.”

The French and British border commissioners, trying to determine what were the “ancient borders” referred to in the treaty, naturally looked at maps published previously as part of the negotiations. However, they could find no consistency nor clear answer, as the maps, both those made by the French and by the British, were unclear and showed contradictory information.


Library of Congress

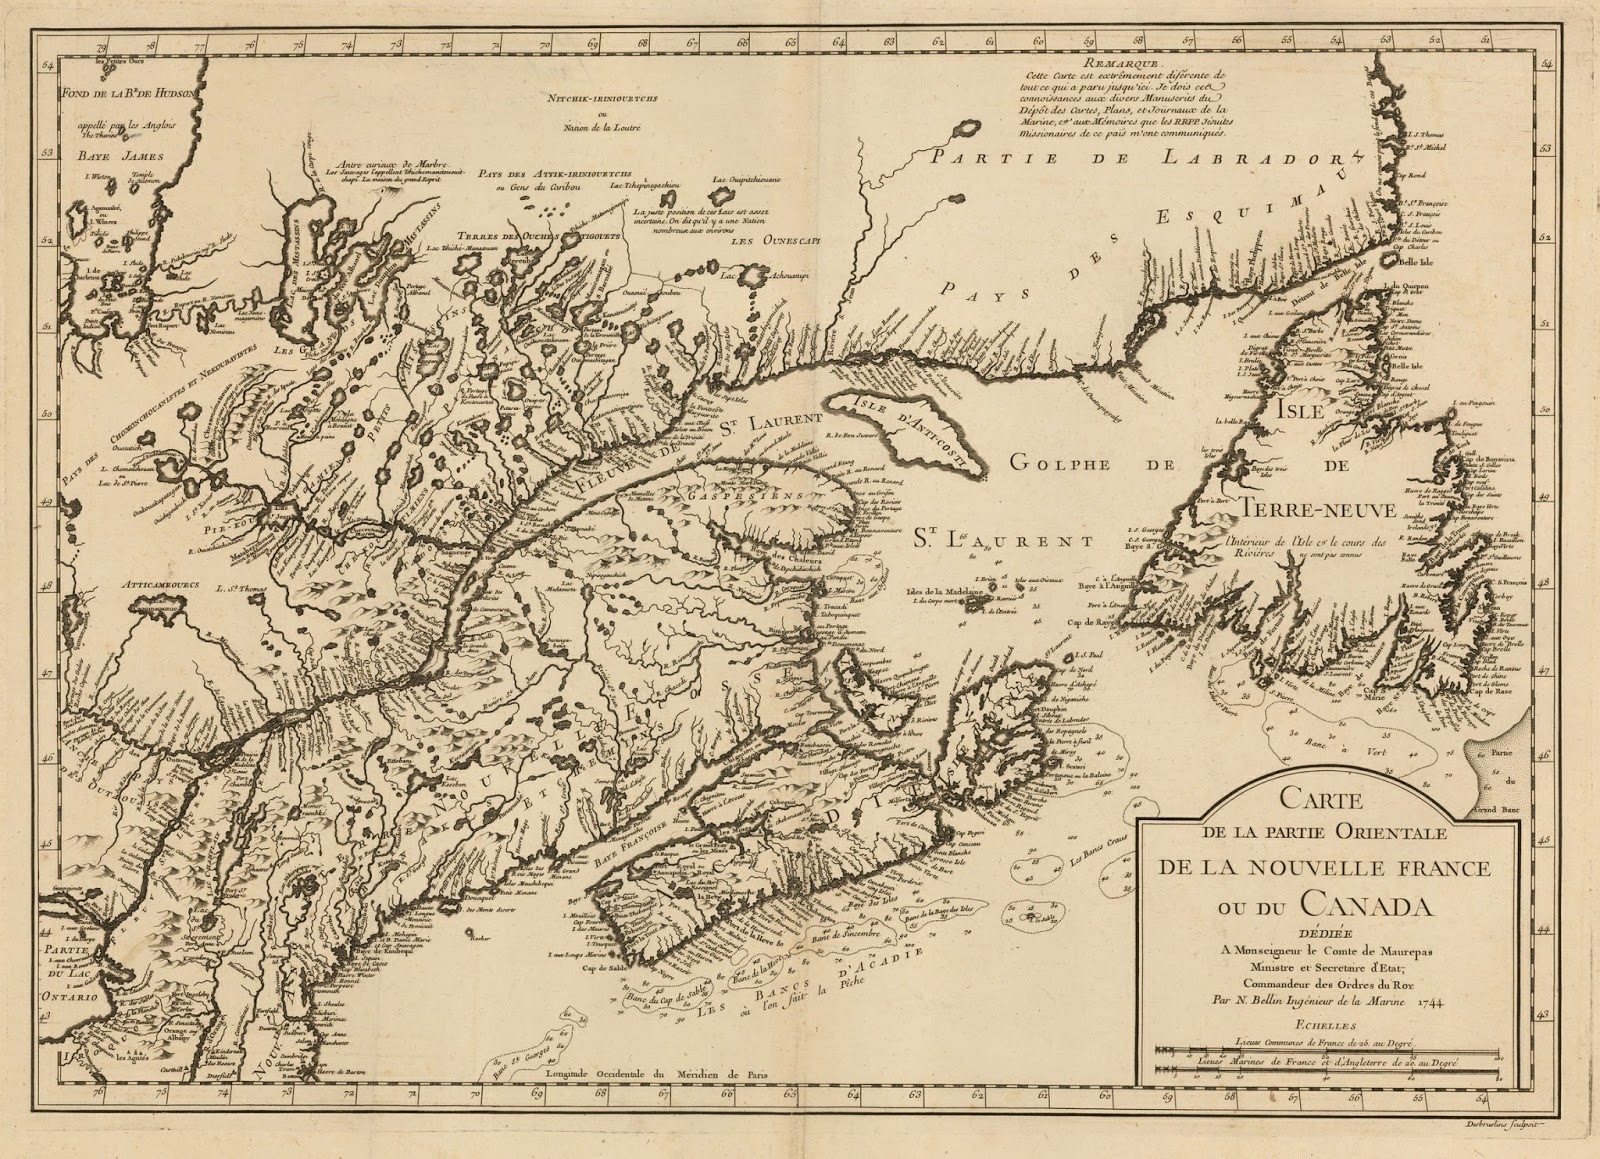
The Acadian boundary dispute was the most important part of the negotiations for both the French and the British commissioners, for it was seen as the key to the sea routes to and from North America and the economic wealth from the nearby fisheries. Thus French and British mapmakers paid special attention to the details in the mapping of the region. One of the leading French mapmakers, Didier Robert du Vaugondy issued a map of Canada in 1753 which made no mention at all of “Nova Scotia” and showed Acadia as referring to a just a small strip along the bottom edge of the peninsula.
This map caused quite a stir in Great Britain, for not only was Vaugondy’s map dedicated to the French secretary of state, but he advertised that his map was based on reports communicated to him from the Ministry of War, implying it represented official French policy. As what the designation “Acadia” referred was just the point then being negotiated by the Boundary Commissioners, Vaugondy had to provide a retraction stating that his map did not reflect an official government position.


Library of Congress

Vaugondy’s map, naturally, provoked a British response with this map by Bradock Mead, which shows Nova Scotia as extending from the peninsula all the way to the St. Lawrence River. Mead was very clear in his attitude to the French maps that claimed otherwise, writing in a 1754 pamphlet, “[France’s] geographers and historians have been influenced to prostitute their pens in the most shameful manner, to serve the injurious cause.”
Interestingly, the Popple map, which had been made specifically to support the British position in North America, actually caused the British negotiators problems two decades later with their claims to the Ohio River Valley. The French commissioners pointed out that Popple did not show the British colonies extending beyond the Appalachians, and that since Popple stated on the map that he “undertook this Map with ye approbation” of the Board of Trade, this implied that it reflected the official British position at the time.

The British had to reply that while the Board “might very well [have approved] of such an Undertaking,” Popple’s map was “framed according to his own particular Notions; he published it upon his own single Authority; the Board of Trade at the Time gave it no extraordinary Sanction... it has ever been thought in Great Britain to be a very incorrect Map, and has never in any Negociation between the two Crowns been appealed to by Great Britain as being correct, or a Map of any Authority.”

In any case, the Boundary Commission negotiations continued through 1753, but no progress was made and soon the commissioners were recalled. Negotiations didn’t stop, however, but changed their nature. The Boundary Commissioners had been tasked with determining what was meant by the terms of the existing treaties, but now there was direct negotiations between British and French officials to work on a new geopolitical agreement with newly determined borders. The discussions continued to focus on the Acadia question and the trans-Appalachian region, with various proposals being put forth, including the possibility of having a neutral ground in between the French and British colonies, with rights to free access by traders of both nations.

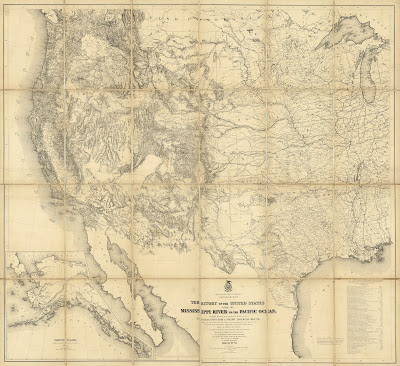
The Boundary Commissioners had used old maps to try to determine existing borders, but in the new negotiations, the British officials wanted accurate maps upon which to establish new boundaries. The problem was that with the discrediting of Popple’s map, they did not have any really good British-made maps of North America. Consequently, in 1749, the Earl of Halifax, the president of the Board of Trade, commissioned a prominent Virginia-born physician, John Mitchell, to compile a map of North America using the Board of Trade’s archives. Mitchell produced a manuscript draft in 1750, but this was seen to be inadequate. Thus the Board sent out another directive to the governors of the American colonies for them to have better maps made and sent to London. As the new maps came in to the Board from the colonies, Mitchell was given access to them.


Newberry Library

The result was that in February 1755, Mitchell’s huge “Map of the British and French Dominions in North America” was published. Mitchell not only used the latest information, but he based the political borders on the original Royal charters and patents, showing the colonies as extending well beyond the Appalachians, and indeed beyond the Mississippi to the edge of the map. In the northeast he showed British lands as not only reaching up to St. Lawrence River and the Great Lakes, but also to lands north of Lakes Ontario and Erie.
It is interesting to note that the Earl of Hardwicke, the British Lord Chancellor, who was in charge of the negotiations then going on with the French, was very concerned about the publication of the map. He wrote:
“I fear very inconvenient Consequences from it, for it carries the Limits of the British Colonies as far, or farther than any other, which I have seen. If it should out just at this juncture with...the Sanction of the Board of Trade, it may fill people’s heads with so strong an opinion of our strict Rights, as may tend to obstruct an Accommodation, if attainable, ...& make what may be necessary to be done to avoid the fatal Evil of a War, the Subject of great Clamour.”

This is actually just what the Board of Trade intended. The Earl of Halifax, the President of the Board, was a hawk in terms of British rights in North America and he specifically wanted the Mitchell map to be released so as to pressure His Majesty’s Government not to concede too much to the French.
That the Mitchell map had an impact on the British public is clear, for reduced versions of the map were published in at least four different British “gentleman’s magazines” within the year.
Illustrated monthly magazines first appeared in London in 1731. These magazines, with such names as Gentleman’s Magazine and London Magazine, contained poetry, prose, and articles on events, fashions, personalities, and other items of the day that might be of interest to the British gentleman. Illustrated by wood and copper engravings, the magazines included many maps, often related to current events.

Naturally, the tensions with the French generated a good number of maps, some appearing as early as the 1740s but then a large number by 1755, when at least 18 magazine maps related to the conflict in North America were issued.

These maps not only informed readers on the events taking place over the oceans, but they also helped to sway public opinion. The many copies of Mitchell’s map in the British magazines, and of course the extraordinary original eight-sheet Mitchell map itself, had a considerable effect on the British public, stiffening their attitude towards any sort of compromise with the French. Not surprisingly, the British government began to take a harder line and very soon the negotiations with the French were broken off.


Click here to see maps of the French & Indian War

While these negotiations had been going on—-to no avail-—events in North America were progressing on their own towards war. Fighting in western Pennsylvania, combined with increased public fervor concerning the French “Incroachments,” as well as concerns elsewhere in the British empire, led to the inevitable declaration of war on May 15, 1756.


Monday, February 12, 2018

Maps of the Scramble for Africa

Our friend, Vince Szilagyi, who is a scholar on the history of maps, especially those related to Africa, recently gave an excellent talk to the Rocky Mountain Map Society, The Scramble for Africa: Colonial Africa Explored through Maps and Artwork.


1844

I found this particularly interesting as it made me realize that for maps of Africa, it is those issued after 1850 which are of particular interest. In general, it is much earlier maps which are of the most interest to collectors, with many focusing on the earliest maps of the sixteenth and seventeenth century, though collectors of American maps are very interested in those from the eighteenth century up to shortly after the middle of the nineteenth century. However, for African maps, one is missing much of the most interesting material if one doesn’t look at the maps issued after 1850.


This is because most of the interesting changes on maps occurred after that time. A regular theme of my blogs and other writing is the fact that maps with a direct connection to history--which show changes or new information or contemporary events--are the ones which are the most interesting and valuable. Most of the printed maps that were published up to the twentieth century were issued in either Europe or America, and in terms of the knowledge of Africa and involvement in events in Africa, most of that took place from 1850 on.


1863

Early in the nineteenth century, European or American knowledge of Africa was very limited to coastal areas, northern Africa and the very southern part of the continent. Africa was, for Europeans and Americans, the Dark Continent. Missionaries and explorers began to extend European knowledge beginning in the middle of the century, with new information beginning to appear on maps shortly thereafter.


1889

However, it was in the 1870s that European interest in Africa went beyond exploration and missionary work, to economic and political colonization. It is a startling fact that in 1870, only about 10% of Africa was under European control, but by 1914, almost 90 percent was!


1898

The “scramble for Africa” had begun, with European countries trying to exert their influence and control as fast as they could. Worried that this would lead to war between the European powers, German chancellor Otto von Bismarck convened what became known as the Berlin Conference, which lasted between November 15, 1884 and February 26, 1885.


With the resulting “General Act of the Berlin Conference,” the European powers basically divided up Africa amongst themselves with no African participation.


1911

The maps of Africa published between 1870 and 1914 document the scramble for Africa and its results in a graphic fashion. Though they are late for most map collectors, these are maps of considerable interest (which, by the way, tend to remain relatively available and inexpensive).


Monday, October 16, 2017

MOUNTAINS ACROSS THE COUNTRY

It has been a while since I’ve written about mythical geography, so today I’m going to look at a myth which appeared in the mid-sixteenth century and which lasted for about a century and a half, that is, the geographic error of showing a mountain range running east to west across the southern part of today’s United States.


This myth had its origins in the reports of the explorations of Hernando De Soto. De Soto was the governor of Cuba and was given a license by the Spanish King to explore “Florida,” which was the name applied to the essentially unknown land north of Cuba which had been discovered by Ponce de León in 1513. De Soto set sail in May, 1539, landing in today’s Tampa Bay with 600 men. He explored to the north and then west, discovering the Mississippi River in May 1541. De Soto died the following year, with the survivors of his expedition sailing down the Mississippi and then along the coast to Spanish settlements in today’s Mexico.


De Soto had set off to the north from the Gulf until he ran into the Appalachian mountains in the area where today's North and South Carolina and Georgia meet. The expedition then marched in a west-southwest direction, following the foothills and this seems to have led to the conception of a range of mountains running across the continent east to west.

This concept is graphically shown in a map probably drawn about 1544 by the Spanish royal cartographer, Alonzo de Santa Cruz, based on reports by the survivors of the De Soto expedition.


This notion soon made it to the general map publishing world, for instance in a 1562 map by Diego Gutiérrez, though he does seem to just scatter a whole series of mountains in North America under the large royal crest.


The east-west mountain range is even more strongly shown on Gerard Mercator’s important 1569 world map, one of the most influential maps of the sixteenth century, as well as graphically on Cornelis de Jode’s “Americae Pars Borealis” [Northern part of America] from 1593.


This notion of a great east-west mountain range running from Georgia to New Mexico was continued into the middle of the following century, principally by the leading cartographer of the day, Nicolas Sanson.

This map makes graphic one of the most important consequences of this belief, the topographical impossibility of a very large and long river emptying into the Gulf of Mexico from the central part of the continent, even though by the middle of the sixteenth century there had been numerous reports of the size of the Mississippi, beginning with the De Soto expedition. Sanson and other cartographers tried to get around this by having numerous shorter rivers joining together to form a large river near the gulf, but the mythical mountain range prevented mapmakers from showing the very real Mississippi River.


The southern Mississippi River had been discovered by De Soto in 1541, with its northern parts first heard of by the French in the Great Lakes region in the early seventeenth century. In 1673, Jolliet and Marquette sailed as far south as the Arkansas River before turning back, and La Salle also explored the northern part of the Mississippi a few years later. Both parties deduced that the river flowed directly south into the Gulf, though this was not yet proved.


In 1683, a map by Louis Hennepin showed the upper part of the Mississippi with a dotted line extending south. Note that Hennepin does not show any orography in North America, thus neatly side-stepping the issue of the mountain range other maps showed blocking the projected course of the Mississippi.


In 1682, La Salle continued his exploration of the Mississippi, this time sailing all the way down to the river’s mouth at the Gulf of Mexico, proving that the river was long as well as wide. However, for a number of reasons, including the idea that there were mountains running east-west across the continent, the mouth of the Mississippi was placed too far west, as shown on the 1691 Le Clercq map of North America. This became the dominant picture of the Mississippi’s course for the rest of the century.


Not all cartographers followed this, as for instance the Robert Morden maps of 1688 showed the mouth of the Mississippi in the correct location, but note how he has the mountains running right up to the river.


It wasn’t until 1703, with Guillaume Delisle’s “Carte du Mexique et de la Floride,” that the Mississippi was firmly placed in its proper course. Delisle was the leading French cartographer of the day and so he had access to the best material of the French explorers in North America. This map was based on reports from many of those explorers, including survivors of the La Salle expedition.


Delisle shows the Mississippi flowing in essentially its correct course, dealing with the east-west mountain range issue by removing it from the map completely.


He did include that mythical range on his 1718 map of North America, though like Morden, he simply stopped it at the Mississippi. This range made an appearance on a few subsequent maps, but generally the western extend moved further and further east until the cartographic picture of the southern Appalachian mountains matched reality.